Mapping street light intensity

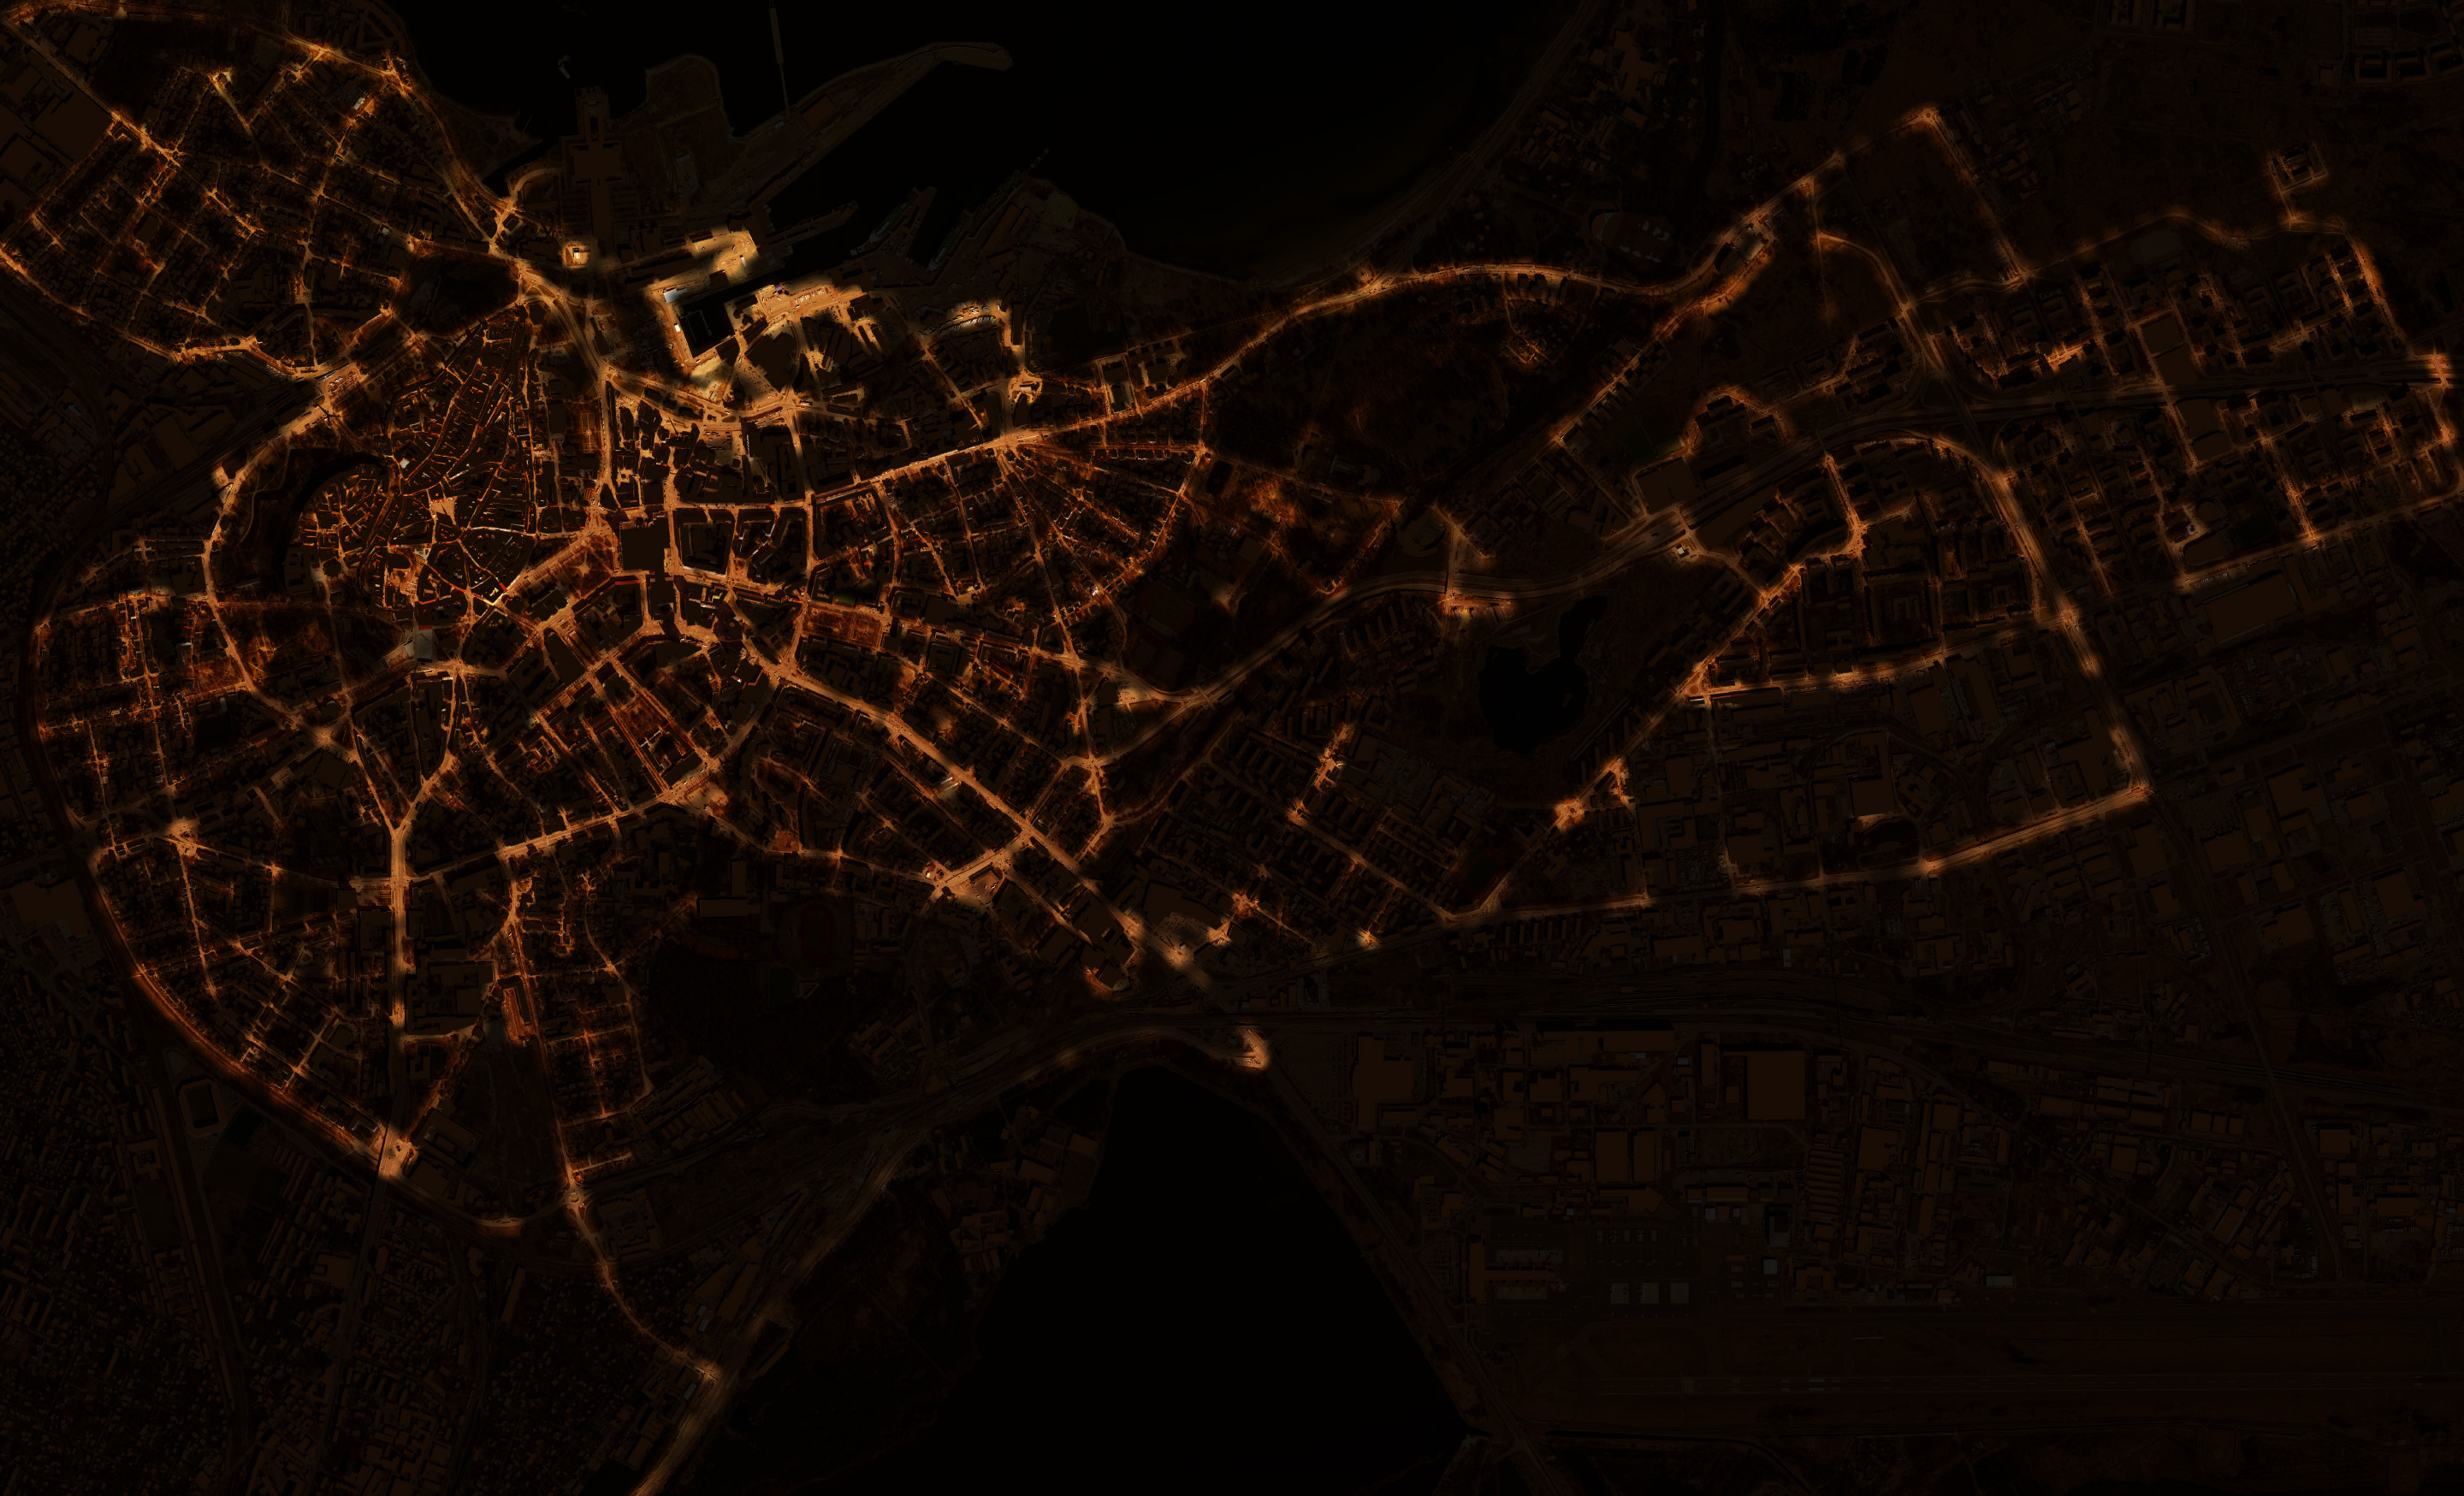
By capitalizing on the wealth and variety of raw data we can collect, we can improve quality of life and personal safety by analysing and tweaking often neglected environmental parameters. The re- appropriation of urban spaces at nighttime was the goal of one of SPIN’s earlier projects, which involved a survey of the artificial illumination across the city of Tallinn, Estonia.

data screen spin unit

We used a creative approach that involved a custom-built device and an Arduino microcontroller to map public illumination. Driving the device around the city, we gathered light intensity data in the darkest hour of the night over two weeks, which we then mapped.

ardu_board
ardu1
bike

Measured street light intensity

data

A false colour reproduction of measured street light intensity.

tallinn night map
night map tallinn spin unit

Downtown Tallinn

night map tallinn spin unit

Kalamaja | Timber house district

night map tallinn spin unit

Lasnamäe | Eastern suburban distrcit

The degree to which an open space is available to as many different people as possible is called accessibility and can be readily computed. So we studied if the urban accessibility was anyhow related with street light intensity.

eaea-11_postertemplate_track-1

We noticed that the level of accessibility of urban spaces decreases with the distance from the city centre and is directly correlated with the level of public illumination.

“While this may seem obvious, we should ask ourselves what is the cause and what the consequence. Can we improve accessibility by improving the quality of public illumination?”

This goes even beyond safety and accessibility. Recently, the Sapienza University in Rome tasked SPIN with producing a report on the illumination inside and outside the Colosseum using similar techniques, in order to improve the way the area is lighted.

colosseum night map picture view